使用 Prometheus 监控 Kubernetes 集群
部署 Prometheus
准备资源配置清单
我们将 prometheus.yml 配置文件以 configmap 的形式存储在 kubernetes 集群中。(configmap.yaml)
apiVersion: v1
kind: ConfigMap
metadata:
  name: prometheus-cfg
  namespace: monitor
data:
  prometheus.yml: |
    global:
      scrape_interval: 30s
      scrape_timeout: 30s
      evaluation_interval: 1m
    scrape_configs:
    - job_name: prometheus
      honor_timestamps: true
      scrape_interval: 30s
      scrape_timeout: 30s
      metrics_path: /metrics
      scheme: http
      follow_redirects: true
      static_configs:
      - targets:
        - localhost:9090

    - job_name: kubernetes-node-exporter
      honor_timestamps: true
      scrape_interval: 30s
      scrape_timeout: 30s
      metrics_path: /metrics
      scheme: http
      bearer_token_file: /var/run/secrets/kubernetes.io/serviceaccount/token
      tls_config:
        ca_file: /var/run/secrets/kubernetes.io/serviceaccount/ca.crt
        insecure_skip_verify: false
      follow_redirects: true
      relabel_configs:
      - separator: ;
        regex: __meta_kubernetes_node_label_(.+)
        replacement: $1
        action: labelmap
      - source_labels: [__meta_kubernetes_role]
        separator: ;
        regex: (.*)
        target_label: kubernetes_role
        replacement: $1
        action: replace
      - source_labels: [__address__]
        separator: ;
        regex: (.*):10250
        target_label: __address__
        replacement: ${1}:9100
        action: replace
      kubernetes_sd_configs:
      - role: node
        follow_redirects: true

    - job_name: kubernetes-node-kubelet
      honor_timestamps: true
      scrape_interval: 30s
      scrape_timeout: 30s
      metrics_path: /metrics
      scheme: https
      bearer_token_file: /var/run/secrets/kubernetes.io/serviceaccount/token
      tls_config:
        ca_file: /var/run/secrets/kubernetes.io/serviceaccount/ca.crt
        insecure_skip_verify: true
      follow_redirects: true
      relabel_configs:
      - separator: ;
        regex: __meta_kubernetes_node_label_(.+)
        replacement: $1
        action: labelmap
      kubernetes_sd_configs:
      - role: node
        follow_redirects: true

    - job_name: traefik
      honor_timestamps: true
      scrape_interval: 30s
      scrape_timeout: 30s
      metrics_path: /metrics
      scheme: http
      follow_redirects: true
      static_configs:
      - targets:
        - traefik.kube-system.svc.cluster.local:8080

    - job_name: kubernetes-apiservers
      kubernetes_sd_configs:
      - role: endpoints
      scheme: https
      tls_config:
        ca_file: /var/run/secrets/kubernetes.io/serviceaccount/ca.crt
      bearer_token_file: /var/run/secrets/kubernetes.io/serviceaccount/token
      relabel_configs:
      - action: keep
        source_labels:
        - __meta_kubernetes_namespace
        - __meta_kubernetes_service_name
        - __meta_kubernetes_endpoint_port_name
        regex: default;kubernetes;https

    - job_name: kubernetes-service-endpoints
      kubernetes_sd_configs:
      - role: endpoints
      relabel_configs:
      - action: keep
        regex: true
        source_labels:
        - __meta_kubernetes_service_annotation_prometheus_io_scrape
      - action: replace
        regex: (https?)
        source_labels:
        - __meta_kubernetes_service_annotation_prometheus_io_scheme
        target_label: __scheme__
      - action: replace
        regex: (.+)
        source_labels:
        - __meta_kubernetes_service_annotation_prometheus_io_path
        target_label: __metrics_path__
      - action: replace
        regex: ([^:]+)(?::\d+)?;(\d+)
        replacement: $1:$2
        source_labels:
        - __address__
        - __meta_kubernetes_service_annotation_prometheus_io_port
        target_label: __address__
      - action: labelmap
        regex: __meta_kubernetes_service_label_(.+)
      - action: replace
        source_labels:
        - __meta_kubernetes_namespace
        target_label: kubernetes_namespace
      - action: replace
        source_labels:
        - __meta_kubernetes_service_name
        target_label: kubernetes_name

    # 监控 service
    - job_name: kubernetes-services
      kubernetes_sd_configs:
      - role: service
      metrics_path: /probe
      params:
        module:
        - http_2xx
      relabel_configs:
      - action: keep
        regex: true
        source_labels:
        - __meta_kubernetes_service_annotation_prometheus_io_probe
      - source_labels:
        - __address__
        target_label: __param_target
      - replacement: blackbox
        target_label: __address__
      - source_labels:
        - __param_target
        target_label: instance
      - action: labelmap
        regex: __meta_kubernetes_service_label_(.+)
      - source_labels:
        - __meta_kubernetes_namespace
        target_label: kubernetes_namespace
      - source_labels:
        - __meta_kubernetes_service_name
        target_label: kubernetes_name

    # 监控 pod
    - job_name: kubernetes-pods
      kubernetes_sd_configs:
      - role: pod
      relabel_configs:
      - action: keep
        regex: true
        source_labels:
        - __meta_kubernetes_pod_annotation_prometheus_io_scrape
      - action: replace
        regex: (.+)
        source_labels:
        - __meta_kubernetes_pod_annotation_prometheus_io_path
        target_label: __metrics_path__
      - action: replace
        regex: ([^:]+)(?::\d+)?;(\d+)
        replacement: $1:$2
        source_labels:
        - __address__
        - __meta_kubernetes_pod_annotation_prometheus_io_port
        target_label: __address__
      - action: labelmap
        regex: __meta_kubernetes_pod_label_(.+)
      - action: replace
        source_labels:
        - __meta_kubernetes_namespace
        target_label: kubernetes_namespace
      - action: replace
        source_labels:
        - __meta_kubernetes_pod_name
        target_label: kubernetes_pod_name
为了将时间序列数据进行持久化,需要提前创建好这个 pvc 对象:(pvc.yaml)
apiVersion: v1
kind: PersistentVolumeClaim
metadata:
  name: prometheus
  namespace: monitor
spec:
  storageClassName: managed-nfs-storage
  accessModes:
  - ReadWriteMany
  resources:
    requests:
      storage: 10Gi
这里使用了 nfs 提供动态 pvc, 关于 nfs 动态 pvc 的配置参考 使用 nfs-subdir-external-provisioner 扩展 NFS 向 kubernetes 提供动态 pvc 功能
因为需要 prometheus 去访问 Kubernetes 的相关信息,所以我们为 prometheus 授予相应的权限:(rbac.yaml)
apiVersion: v1
kind: Namespace
metadata:
  name: monitor
---
apiVersion: v1
kind: ServiceAccount
metadata:
  name: prometheus
  namespace: monitor
---
apiVersion: rbac.authorization.k8s.io/v1
kind: ClusterRole
metadata:
  name: prometheus
rules:
- apiGroups:
  - ""
  resources:
  - nodes
  - services
  - endpoints
  - pods
  - nodes/proxy
  verbs:
  - get
  - list
  - watch
- apiGroups:
  - "extensions"
  resources:
    - ingresses
  verbs:
  - get
  - list
  - watch
- apiGroups:
  - ""
  resources:
  - configmaps
  - nodes/metrics
  verbs:
  - get
- nonResourceURLs:
  - /metrics
  verbs:
  - get
---
apiVersion: rbac.authorization.k8s.io/v1beta1
kind: ClusterRoleBinding
metadata:
  name: prometheus
roleRef:
  apiGroup: rbac.authorization.k8s.io
  kind: ClusterRole
  name: prometheus
subjects:
- kind: ServiceAccount
  name: prometheus
  namespace: monitor
最创建 prometheus 的资源配置清单(deployment.yaml)
apiVersion: apps/v1
kind: Deployment
metadata:
  labels:
    app: prometheus
  name: prometheus
  namespace: monitor
spec:
  replicas: 1
  selector:
    matchLabels:
      app: prometheus
  template:
    metadata:
      labels:
        app: prometheus
    spec:
      serviceAccountName: prometheus
      containers:
      - name: prometheus
        image: prom/prometheus:v2.26.0
        command:
        - "/bin/prometheus"
        args:
        - "--config.file=/etc/prometheus/prometheus.yml"
        - "--storage.tsdb.path=/prometheus"
        - "--storage.tsdb.retention.time=24h"
        - "--web.console.libraries=/usr/share/prometheus/console_libraries"
        - "--web.console.templates=/usr/share/prometheus/consoles"
        - "--web.enable-lifecycle"
        - "--web.enable-admin-api"
        ports:
        - containerPort: 9090
          protocol: TCP
          name: http
        volumeMounts:
        - name: data
          mountPath: "/prometheus"
        - name: config
          mountPath: "/etc/prometheus"
        resources:
          requests:
            cpu: 100m
            memory: 512Mi
          limits:
            cpu: 200m
            memory: 512Mi
      securityContext:
        runAsUser: 0
      volumes:
      - name: data
        persistentVolumeClaim:
          claimName: prometheus
      - name: config
        configMap:
          name: prometheus-cfg
          defaultMode: 0644

---
apiVersion: v1
kind: Service
metadata:
  labels:
    app: prometheus
  name: prometheus
  namespace: monitor
spec:
  ports:
  - name: "http"
    port: 9090
    protocol: TCP
    targetPort: 9090
  selector:
    app: prometheus
  type: ClusterIP
有一个要注意的地方是我们这里必须要添加一个
securityContext的属性,将其中的runAsUser设置为0, 这是因为现在的prometheus运行过程中使用的用户是nobody,否则会出现下面的permission denied之类的权限错误
部署 Prometheus 相关资源
按顺序应用资源配置清单
kubectl apply -f rbac.yaml
kubectl apply -f pvc.yaml
kubectl apply -f configmap.yaml
kubectl apply -f deployment.yaml
使用 traefik 暴露 prometheus 服务: ingress-route.yaml
apiVersion: traefik.containo.us/v1alpha1
kind: IngressRoute
metadata:
  name: prometheus
  namespace: monitor
spec:
  entryPoints:
    - web
  routes:
  - match: Host(`mon.host.com`)
    kind: Rule
    services:
    - name: prometheus
      port: 9090
应用
kubectl apply -f ingress-route.yaml部署 node-exporter 监控所有节点
准备 node-exporter.yaml
apiVersion: apps/v1
kind: DaemonSet
metadata:
  labels:
    app: node-exporter
  name: node-exporter
  namespace: monitor
spec:
  selector:
    matchLabels:
      app: node-exporter
  template:
    metadata:
      labels:
        app: node-exporter
    spec:
      hostPID: true
      hostIPC: true
      hostNetwork: true
      containers:
      - name: node-exporter
        image: prom/node-exporter:v1.1.2
        command:
        - "/bin/node_exporter"
        args:
        - "--path.procfs=/host/proc"
        - "--path.sysfs=/host/sys"
        - "--collector.filesystem.ignored-mount-points='^/(dev|proc|sys|host|etc)($|/)'"
        ports:
        - containerPort: 9100
          protocol: TCP
          name: http
        securityContext:
          privileged: true
        volumeMounts:
        - name: dev
          mountPath: "/host/dev"
        - name: proc
          mountPath: "/host/proc"
        - name: sys
          mountPath: "/host/sys"
        - name: rootfs
          mountPath: "/rootfs"
        resources:
          requests:
            cpu: 100m
            memory: 128Mi
          limits:
            cpu: 100m
            memory: 128Mi
      tolerations:
      - key: "node-role.kubernetes.io/master"
        operator: "Exists"
        effect: "NoSchedule"
      volumes:
      - name: proc
        hostPath:
          path: /proc
      - name: dev
        hostPath:
          path: /dev
      - name: sys
        hostPath:
          path: /sys
      - name: rootfs
        hostPath:
          path: /
由于我们需要监控所有节点包括主节点,所有需要忽略主节点上的污点, 加入
tolerations配置项,使用DaemonSet方式部署
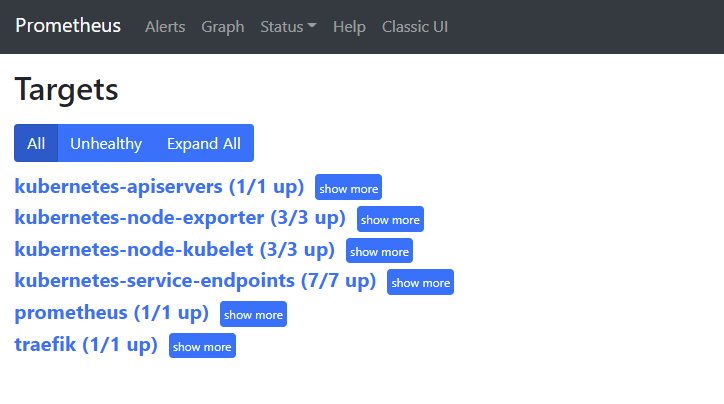
kubectl apply -f node-exporter.yaml查看 Prometheus 监控 Targets 状态
使用 Grafana 展示 Prometheus 监控数据
部署 Grafana
grafana.yaml
---
apiVersion: v1
kind: PersistentVolumeClaim
metadata:
  name: grafana
  namespace: monitor
spec:
  storageClassName: managed-nfs-storage
  accessModes:
  - ReadWriteMany
  resources:
    requests:
      storage: 1Gi
---
apiVersion: apps/v1
kind: Deployment
metadata:
  name: grafana
  namespace: monitor
  labels:
    app: grafana
spec:
  revisionHistoryLimit: 10
  selector:
    matchLabels:
      app: grafana
  template:
    metadata:
      labels:
        app: grafana
    spec:
      containers:
      - name: grafana
        image: grafana/grafana:7.5.4
        imagePullPolicy: IfNotPresent
        ports:
        - containerPort: 3000
          name: grafana
        env:
        - name: GF_SECURITY_ADMIN_USER
          value: admin
        - name: GF_SECURITY_ADMIN_PASSWORD
          value: admin321
        readinessProbe:
          failureThreshold: 10
          httpGet:
            path: /api/health
            port: 3000
            scheme: HTTP
          initialDelaySeconds: 60
          periodSeconds: 10
          successThreshold: 1
          timeoutSeconds: 30
        livenessProbe:
          failureThreshold: 3
          httpGet:
            path: /api/health
            port: 3000
            scheme: HTTP
          periodSeconds: 10
          successThreshold: 1
          timeoutSeconds: 1
        resources:
          limits:
            cpu: 100m
            memory: 256Mi
          requests:
            cpu: 100m
            memory: 256Mi
        volumeMounts:
        - mountPath: /var/lib/grafana
          subPath: grafana
          name: storage
      securityContext:
        runAsUser: 0
      volumes:
      - name: storage
        persistentVolumeClaim:
          claimName: grafana
---
apiVersion: v1
kind: Service
metadata:
  labels:
    app: grafana
  name: grafana
  namespace: monitor
spec:
  ports:
  - name: "http"
    port: 3000
    protocol: TCP
    targetPort: 3000
  selector:
    app: grafana
  type: ClusterIP
---
apiVersion: traefik.containo.us/v1alpha1
kind: IngressRoute
metadata:
  name: grafana
  namespace: monitor
spec:
  entryPoints:
    - web
  routes:
  - match: Host(`grafana.host.com`)
    kind: Rule
    services:
    - name: grafana
      port: 3000
应用 grafana.yaml
kubectl apply -f grafana.yml安装 Grafana 插件
插件安装有两种方式:
- 进入 Container 中,执行
grafana-cli plugins install $plugin_name - 手动下载插件zip包,访问 https://grafana.com/grafana/plugins/ 下载 zip 包解压到
/var/lib/grafana/plugins目录中
插件安装完毕后,需要重启
Grafana的Pod
进入容器运行如下命令安装插件
grafana-cli plugins install grafana-kubernetes-app
grafana-cli plugins install grafana-clock-panel
grafana-cli plugins install grafana-piechart-panel
grafana-cli plugins install briangann-gauge-panel
grafana-cli plugins install natel-discrete-panel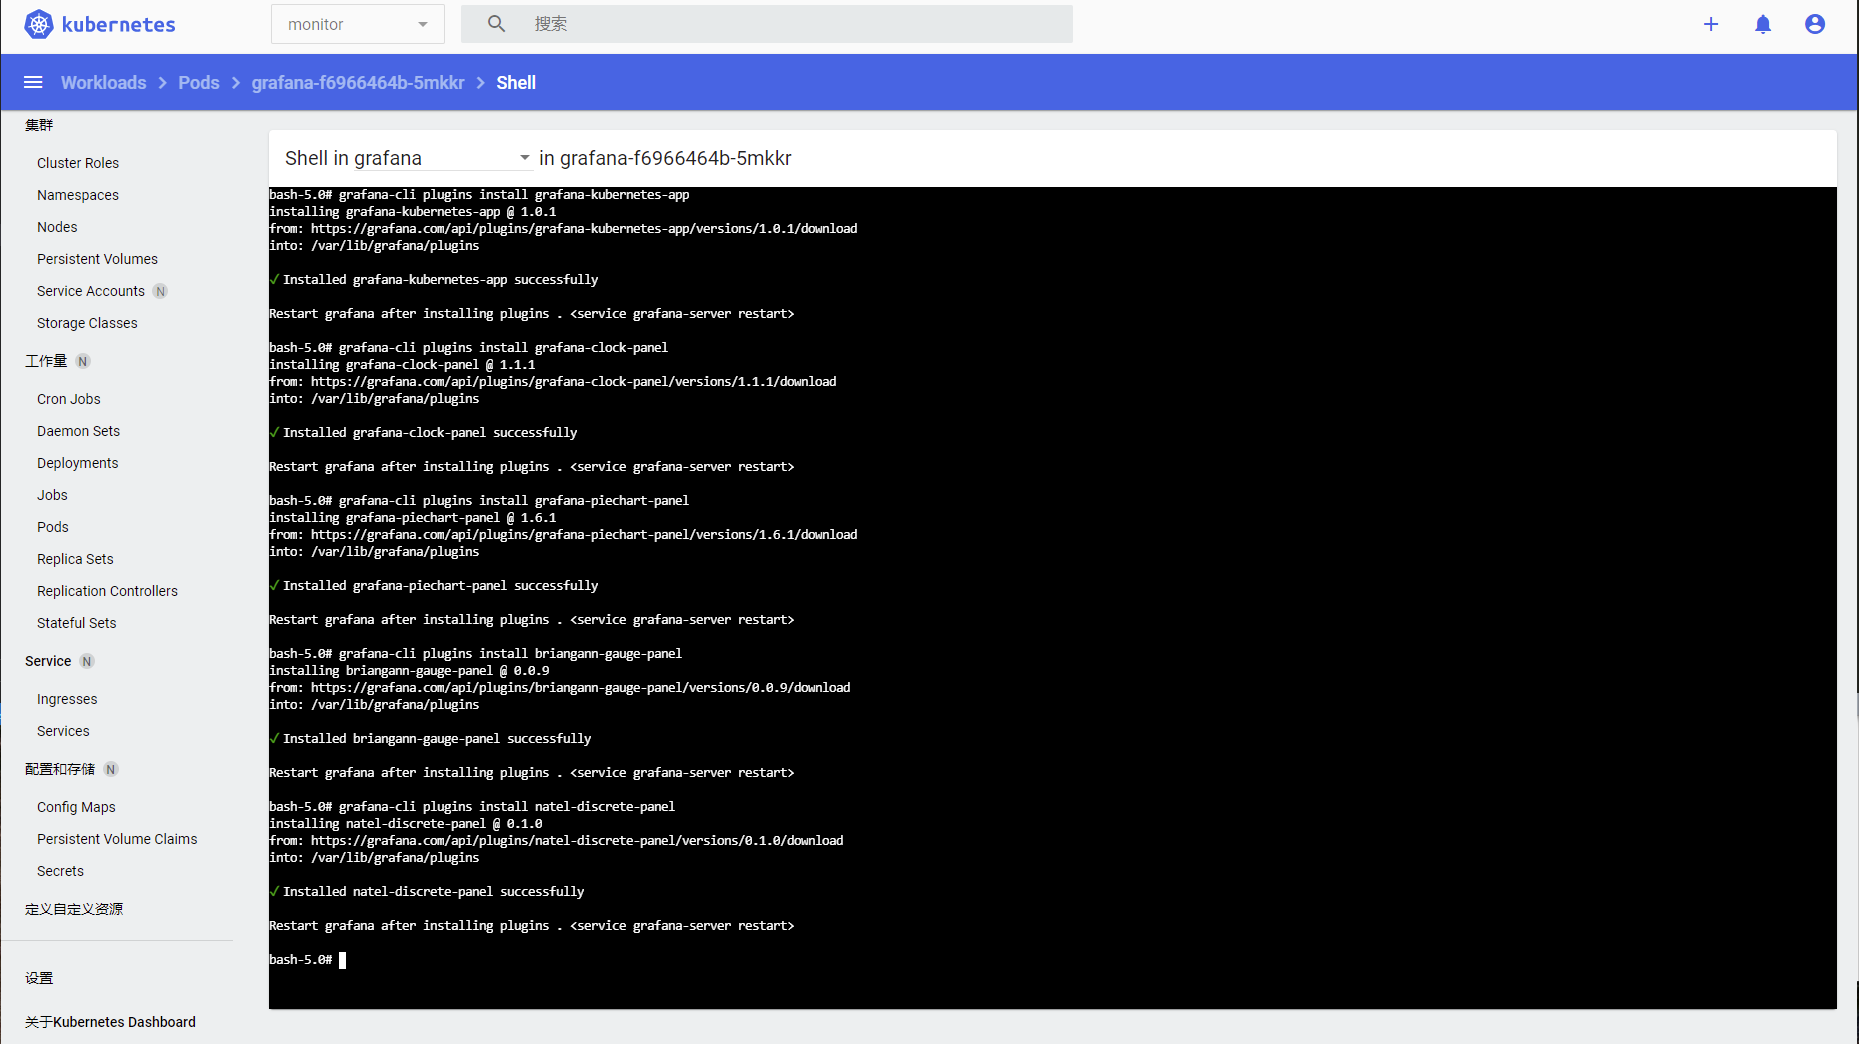
配置 prometheus 数据源
浏览器打开 grafana.host.com 使用用户名: admin, 密码: admin321 登录,进入 Configuration -> Data Sources -> Add Data Source 选择 Prometheus Url 为 http://prometheus:9090 Access: Server(default) 其他均为默认。

配置 kubernetes 插件
进入插件管理页面,先启用 kubernetes 插件
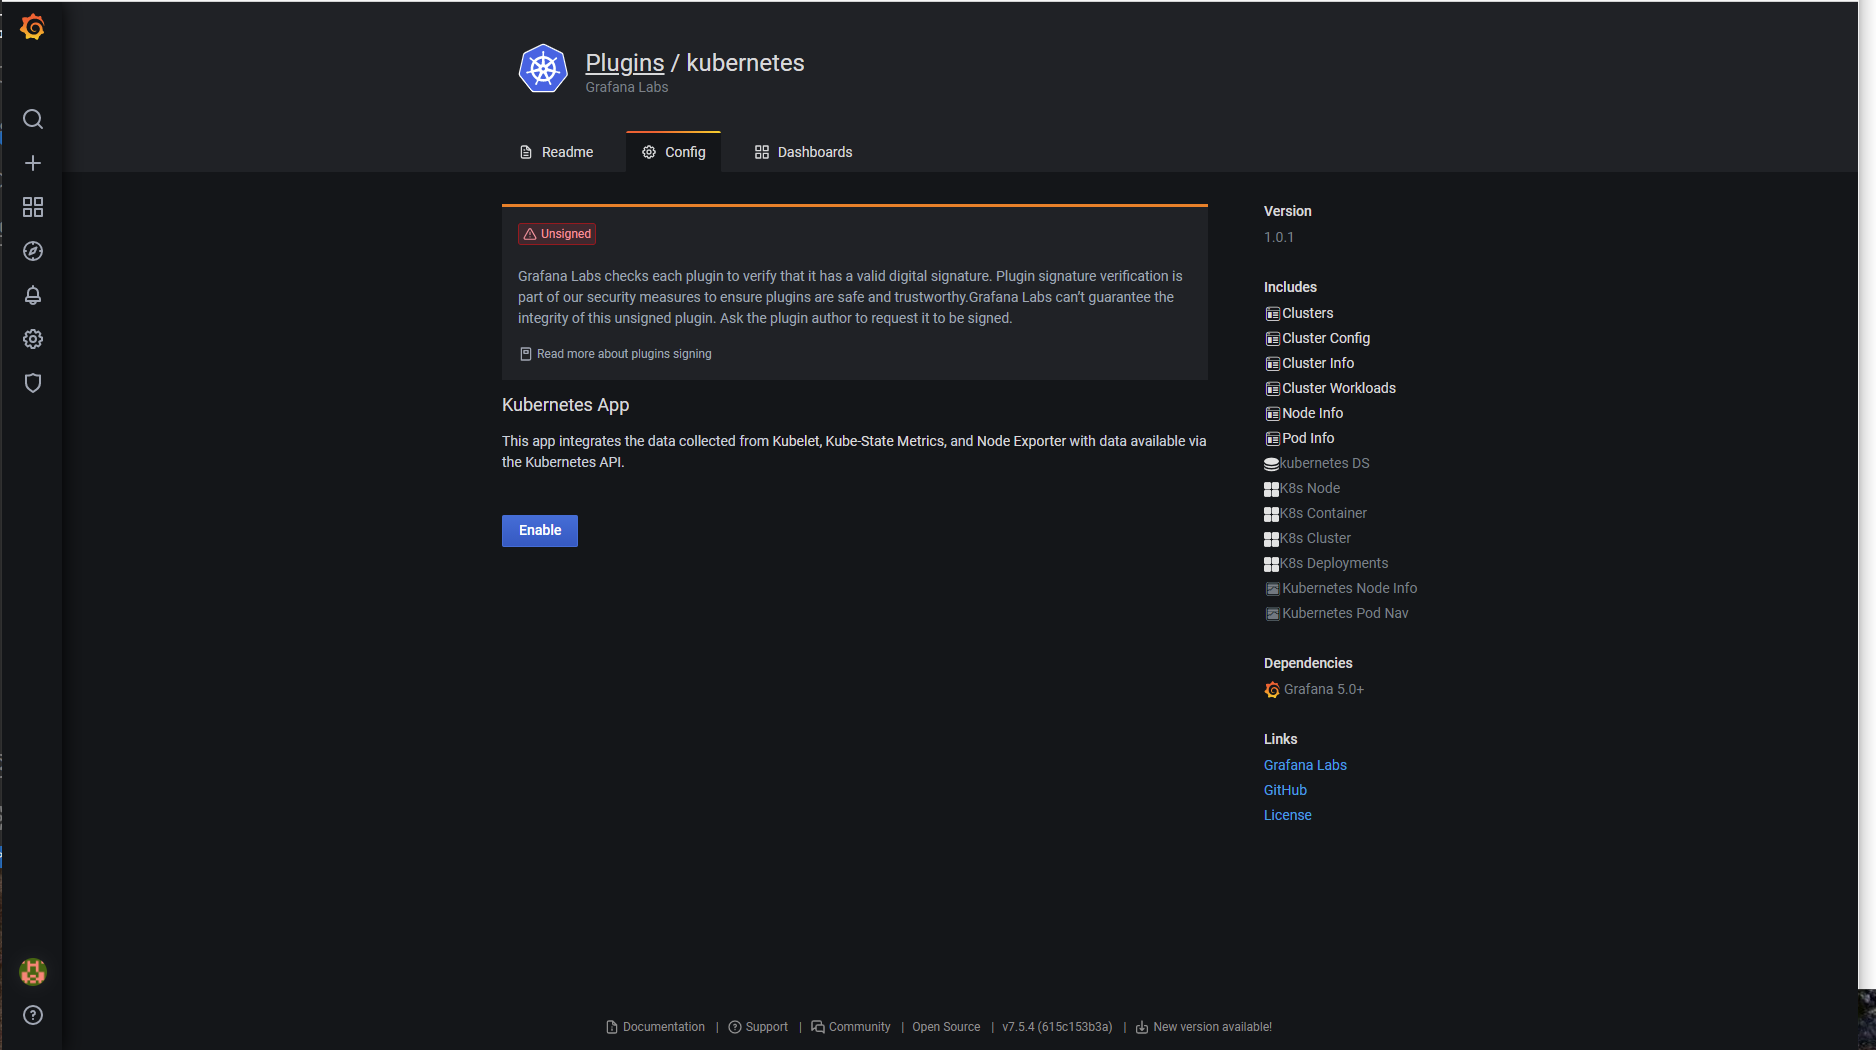
配置 kubernetes 插件
